By: Colton Powell & Beth Nolan
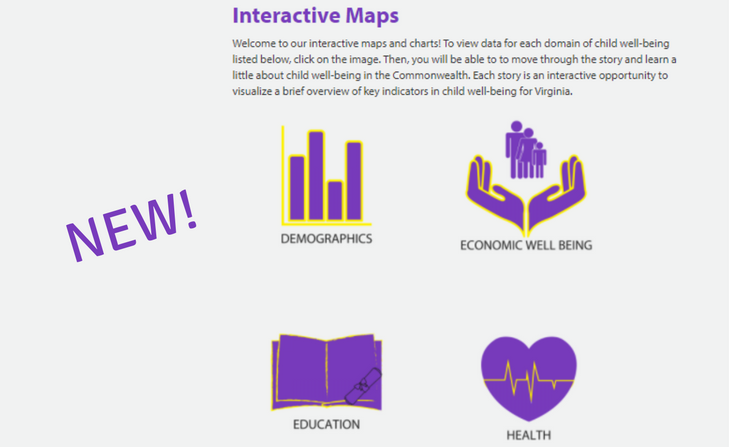
Voices is thrilled to share with you our new and improved interactive data page, which displays key indicators in four areas of child well-being.
Get the answer to these questions and more in this new series of interactive stories, covering child demographics, economic well-being, education, and health. Each story contains maps, graphs, and tables that you can manipulate and interact with.
We hope you find these stories and its data useful in seeing how kids are faring in your locality and across the Commonwealth!
For additional information on the stories, its data, or to have a personalized presentation for your region or organization, please contact KIDS COUNT Director, Beth Nolan at Beth@vakids.org.
Read More Blog Posts